The rise of China's global companies
- By John Ross
 0 Comment(s)
 Print
Print E-mail China.org.cn, September 16, 2013
More general international assessments of the positions of China's companies are sometimes made by analyzing the Fortune Global 500. The disadvantage of this is that while 500 companies may be a sufficient sample for an individual country, it is rather small for the total global economy and a larger sample of international companies exists in the 2,000 world's largest publicly listed companies in the "Forbes 2000." As the combined revenue of the latter companies is equivalent to 50 percent of world GDP, they provide a more accurate view of global competition.
Analyzing first the overall position of China's companies, the dramatic rise is clear. In 2007, on the eve of the international financial crisis, China had only 56 companies among the world's 2,000 largest listed firms. By 2013 this had risen to 149.
In revenue terms the change was even more dramatic. In 2004 China's companies accounted for only 0.8 percent of the revenue of the Forbes 2000. By 2007 this figure had only risen to 1.9 percent - China's position was marginal. However by 2013 China's companies accounted for 8.5 percent of the revenue of the 2,000 companies - a position exceeded only by Japan and the U.S. This data is shown in Table 1.
Between 2007 and 2013 China overtook all the individual European countries. In profits the shift was even greater. By 2013 China accounted for 12.9 percent of the profits of the world's 2,000 largest quoted companies - compared to 3.2 percent in 2007. The international position of China's companies has therefore strengthened significantly since the international financial crisis began in 2008.
A more detailed analysis of sectors of global competition reveals a pattern of strengths and weaknesses by China's companies differing significantly from "conventional wisdom."China is frequently conceived of as fundamentally a manufacturing economy. Manufacturing production within China is indeed now over 20 percent higher than the U.S. But China is a manufacturing base not only for its own companies but for foreign multinationals. It is necessary to distinguish between China as a base for manufacturing and the position of China's own manufacturing companies.
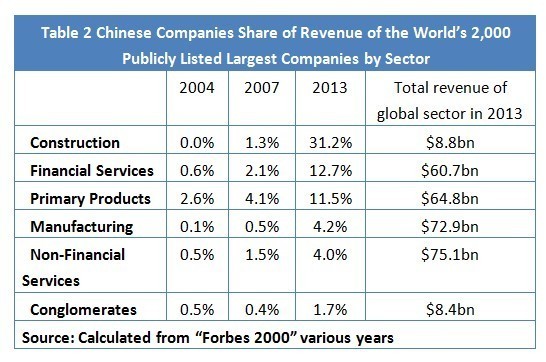
China's manufacturing firms have made significant progress in global competition -as is shown in Table 2. Their share of the revenue of Forbes 2000 manufacturing companies rose from 0.5 percent in 2007 to 4.2 percent in 2013. But this position remains weaker not only than the U.S. (31.7 percent) and Japan (17.8 percent), but also Germany (8.8 percent) and France (5.0 percent). Only in two manufacturing sectors, capital goods (12.7 percent) and consumer durables (5.2 percent), do Chinese companies hold above a 5 percent global market share.

Table 2 instead shows the actual international strengths and weaknesses of China's companies. It should be noted that this Table's classification differs from some frequently used as it divides service industries into two sectors - financial and non-financial. The reason this is necessary becomes clear when the different position held by China in these different sectors of service companies is analyzed.


